A gate that passed, and a rule that ran backwards
Three results from one day, and they only make sense together. One finding survived. One rule turned out to have been backwards in production for months. And one "pass" was pure noise that we nearly wrote up as a discovery.
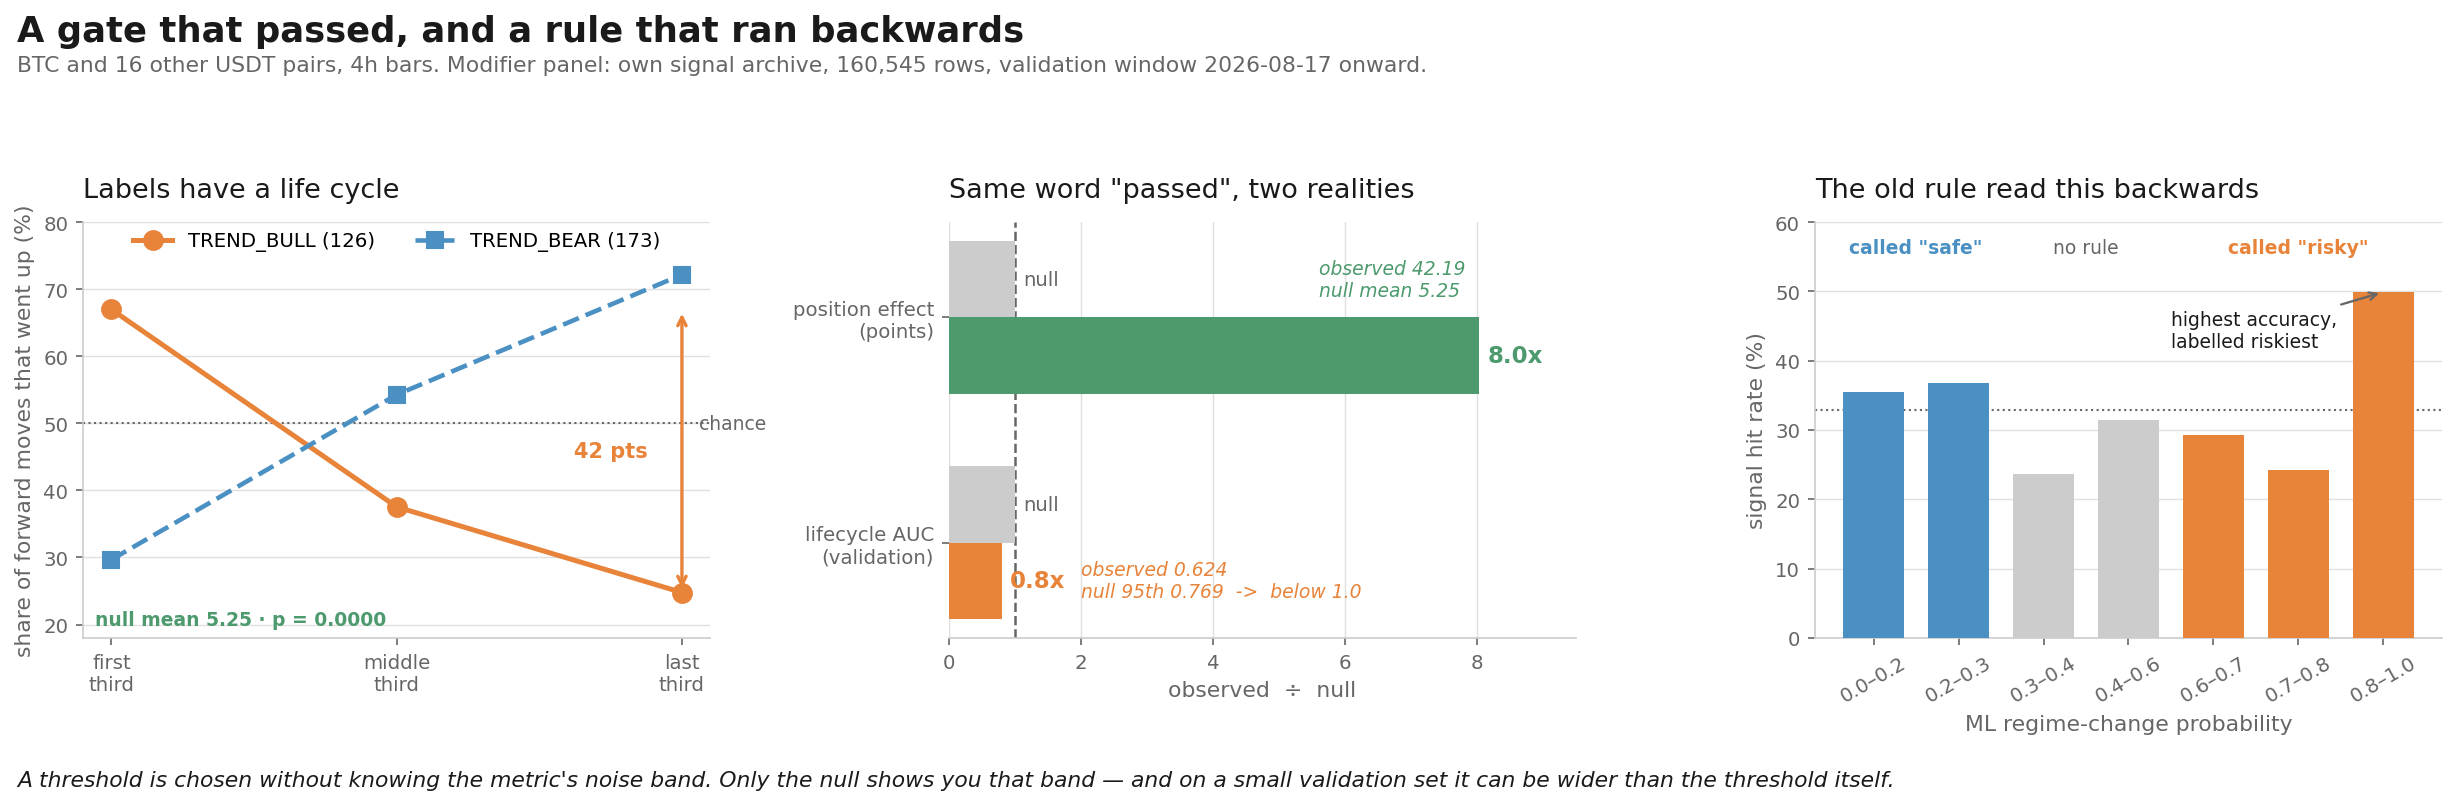
1. Regime labels have a life cycle
Our system tags each 4h bar as TREND_BULL / TREND_BEAR / RANGE / CHAOS. We went in expecting the bull label to arrive late — EMA200 on 4h is a 33-day average, so by the time price clears it the move should be mostly over.
Wrong. At the moment the label opens, the forward 24-bar return is positive 67.0% of the time, averaging +4.11%. The move is still running.
What we found instead was position inside the block. Splitting each uninterrupted label run into thirds:
| TREND_BULL (126 blocks) | TREND_BEAR (173 blocks) | |
|---|---|---|
| first third | 67.0% +4.106% | 29.7% −2.921% |
| middle third | 37.5% +0.754% | 54.3% +0.723% |
| last third | 24.8% −2.342% | 72.2% +4.780% |
42.2 points, mirrored in the bear label (−42.5). Circular-shift null: p = 0.0000, null mean 5.25, 95th percentile 13.32.
The obvious objection is tautology. A block ends when the label flips, which is by definition the moment price turns — a forward window crossing that boundary captures the reversal for free. So we clipped the forward return to stay inside the block: 42.2 → 39.3 points, 93% survives. Not a boundary artifact.
Implementation checks: ADX/DI matches the ta library on 440/440 bars for the adx>20 AND +DI>−DI decision, and the recomputed label matches the live value on 5/5 symbols.
But this is not tradeable, and the reason is the next section.
2. You cannot know which third you are in
Position inside a block is only knowable in hindsight. To use it live you would need to predict the block's lifetime at the moment it opens. We tried twice.
Attempt one — predict log(lifetime) from opening features. Out-of-sample R² = −0.0903. Not overfitting: dropping to a single feature makes it worse (−0.2517). The real cause is that lifetime itself drifts — median 5 bars in the discovery window, 11 in validation. A pooled correlation of 0.392 for the DI spread does not survive the split.
Attempt two — classify long vs short instead. Ranking-based targets should be immune to a level shift, which was a genuinely better idea. Thresholds (Q1/Q3) were taken from discovery only; taking them from the full sample would be look-ahead.
Validation AUC came out 0.6239, clearing our pre-registered 0.60 gate.
Then the null:
observed AUC : 0.6239

            null 95th    : 0.7692   ← the null is HIGHER than the observation

            p            : 0.3415
With 48 blocks in validation (39 long / 9 short), random labels routinely score 0.77. The gate told us nothing. Without that null we would have written this up as a finding.
Discovery AUC was 0.9068 against 0.6239 out of sample, which is the other tell.
3. A production rule that had its sign backwards
Separately, our fragility score gets adjusted by an ML regime-change probability. Two rules, live for months:
prob > 0.6 and signal agrees with regime  →  +10..+14  ("risky")

            prob < 0.3 and signal agrees with regime  →  −7..−9    ("safe")
We had never measured whether this helped. It does not — it hurts, by delta_AUC −0.0213. And the harm is systematic: a null that permutes the modifier across rows averages −0.0048, so scattering it at random would have done less damage than where it actually landed (p = 0.0000).
The reason is that both rules point the wrong way:
| rule | what it claimed | actual hit rate |
|---|---|---|
| prob > 0.6 | risky | 37.8% (vs 33.2% below it) |
| prob < 0.3 | safe | 35.9% (vs 34.3%) — a 1.6 point gap |
The real relationship is U-shaped — accuracy is high at both ends, low in the middle:
| probability | hit rate | probability | hit rate |
|---|---|---|---|
| 0.0–0.2 | 35.5% | 0.6–0.7 | 29.3% |
| 0.2–0.3 | 36.8% | 0.7–0.8 | 24.2% |
| 0.3–0.4 | 23.6% | 0.8–1.0 | 49.9% |
| 0.4–0.6 | 31.4% |
No pair of linear thresholds can express that, which is why the rule was inverted rather than merely mistuned.
Fixing it without fitting to the diagnosis
Everything above came from the full sample. Writing a new rule from those numbers would be fitting the fix to the data that revealed the problem. So the diagnosis became discovery, three candidates were locked before looking at the validation window, and the thresholds were not chosen from the diagnosis — 0.3 carries over from the old rule, 0.7 and a fixed magnitude of 8 were written into the expectation file.
| candidate | discovery | validation |
|---|---|---|
| A_INVERTED | +0.0301 | −0.0061 sign flipped |
| B_U_SHAPE | +0.0188 | +0.0371 held, and grew |
| C_OFF | — | reference |
A looked strongest in discovery. Without the split window it would have been the one we shipped.
B passed all three gates. The check that convinced us is independent of AUC entirely — in the validation window, the edge group hits 45.3% (n=3096) against the middle group's 37.4% (n=1570), a 7.9 point gap.
One thing worth stating plainly: the fragility score itself does not discriminate — raw AUC 0.5006, chance. B is not fixing fragility. It is reading the probability the right way round.
What this taught us
Two results sat side by side, both technically "passing":
| observed | null mean | null 95th | |
|---|---|---|---|
| position effect | 42.19 | 5.25 | 13.32 |
| lifecycle AUC | 0.624 | — | 0.769 |
Same word, two different realities. It pushed us to separate three things we had been treating as one gate:
- minimum performance — does it clear a threshold?
- null superiority — does it beat randomised labels?
- practical size — is the gap big enough to matter?
A threshold chosen in advance is still the right discipline. But a threshold is chosen without knowing the metric's noise band, and only the null shows you that band. On a small validation set the band can be wider than the threshold itself.
Caveats
17 USDT pairs, 4h bars, 1000 of them (~167 days), one asset class.
The modifier work uses our own signal archive: 160,545 rows, 2026-04-26 to 09-07, discovery/validation split at 08-17, so validation is only three weeks. Forward return is measured over 24 hours while the modifier is applied on a 4h cycle — a scale mismatch we have not resolved. The archive also contains 66 tokenised equities we did not filter out.
The third rule in the modifier (keyed on predicted regime) could not be measured at all — the archive has no predicted-regime column — so it remains live and untested.
Two rejections in one day — one passed its null with p=0.0000 and was rejected anyway.
Why did they all fail at the same point? — nineteen candidates, one shared gate.